
Custom Reporting built for business impact
Design metrics and dashboards that reveal risk, surface customer friction, and inform strategic decisions.


Customizable Report Creation
Data at a glance, insights in depth
Harness the power of tailored charts to quickly capture performance trends and dive deeper into actionable insights.

Create line, bar, donut charts, and more from QA data and custom metrics
Reveal trends and correlations across QA metrics and custom insights
Navigate directly from visual charts to detailed data breakdowns
%201.png)
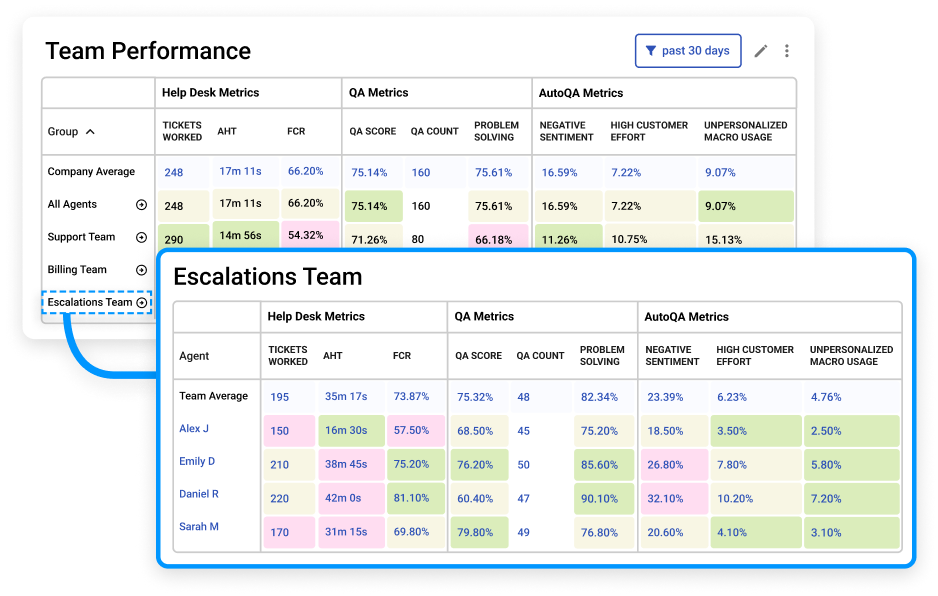
Unified Insights
Do more in a single platform
All of your metrics in one place — get tailored insights for your organization’s critical workflows.
Achieve comprehensive visibility by integrating Auto QA, Manual QA, helpdesk, and workforce management data
Effortless monitoring of multiple metrics on a unified dashboard
Streamline coaching and development with a consolidated view
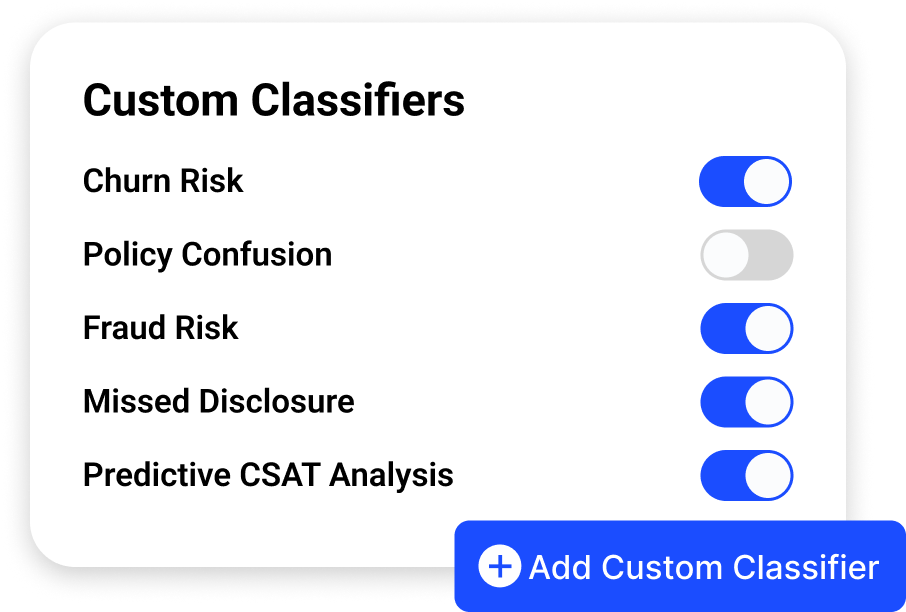
Custom Metrics
Tailored insights for deeper analysis
Unlock the full potential of your data by creating custom metrics that align with your team’s unique workflows. Analyze 100% of tickets to uncover trends, root causes, and actionable insights.
Phrase Match Metrics: Identify specific words or phrases across all interactions to track key trends
LLM Metrics: Leverage AI-powered analysis based on your business-specific criteria to gain deeper insights. Calibrate with our AI Calibration Platform to ensure accuracy.
Process-Based Metrics: Analyze your defined business processes across every ticket for a complete performance overview
Explore our dashboard features

Shareable dashboards
Customize dashboards for agents and non-agents, share team-specific views for targeted insights, and distribute admin-curated dashboards for unified visibility.

Customization options
Generate custom heat maps for trend spotting, design precise bespoke dashboards, and easily fine-tune details with various display options and filters.

Gamified leaderboards
Transform tracking into engaging experiences, foster friendly competition with leaderboards, and gain holistic agent rankings insights.

Unique use cases
Embrace innovative QA for business-wide excellence, explore insights with tailored use cases aligned with your goals, and extend excellence beyond typical interactions.

AI-enhanced insights
Unlock customizable Auto QA metrics, automated agent quality KPIs, and targeted QA for comprehensive root cause analysis.

Amplify impact
Leverage QA results for agent collaboration, gain insights into BPO performance for continuous improvement, and articulate QA's value for ROI.

With MaestroQA's heat map, we've left the old world of navigating through multiple spreadsheets behind. Now, everything is in one place - a true game-changer for productivity and clarity.

Workflow analytics
Visualizing performance
Delve into Screen Capture metrics to analyze and understand workflows at a deeper level.
Elevate the coaching experience with enriched insights through Screen Capture videos
Back up data with valuable observations captured through back-office workflow analysis
Find coaching and process insights faster by highlighting the moments that matter in your recordings

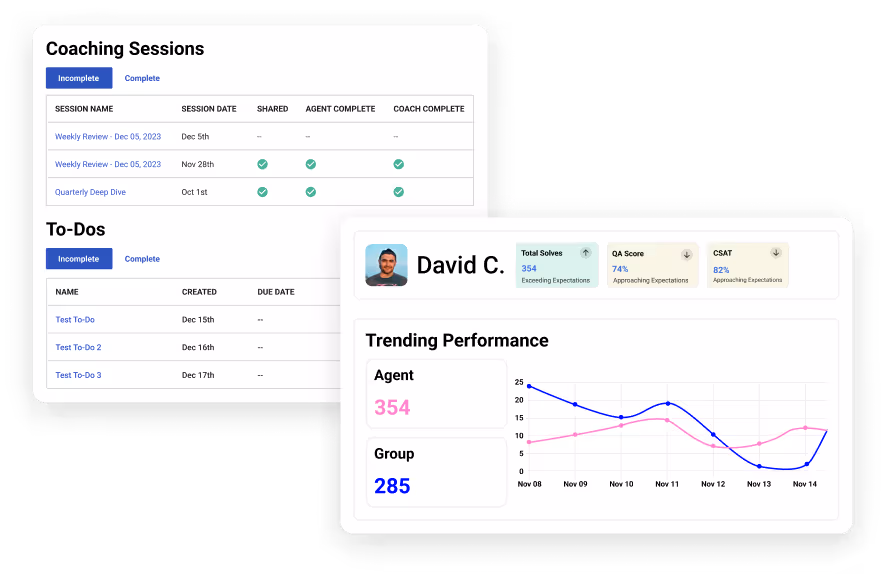
Agent development
Coaching, grading, and beyond
Grant non-agents a bird's-eye view of rankings on the Performance Dashboard.
Coach, grade, and provide feedback directly from the dashboard
Elevate your coaching sessions with insights gathered from your custom dashboards
Identify training needs and proactively address underlying issues


